Showing posts with label profiling. Show all posts

Monday, March 11, 2019

Lies, darn lies and sampling bias

Sampling profiling is very powerful technique widely used across various platforms for identifying hot code (execution bottlenecks).

In Java world sampling profiling (thread stack sampling to be precise) is supported by every serious profiler.

While being powerful and very handy in practice, sampling has well known weakness – sampling bias. It is real and well-known problem, though its practical impact is often being over exaggerated.

A picture is worth a thousand of words, so let me jump start with example.

Case 1

Below is a simple snippet of code. This snippet is doing cryptographic hash calculation over a bunch of random strings.

import java.security.MessageDigest;
import java.security.NoSuchAlgorithmException;
import java.util.concurrent.TimeUnit;

public class CryptoBench {

 private static final boolean trackTime = Boolean.getBoolean("trackTime");
 
 public static void main(String[] args) {
  CryptoBench test = new CryptoBench();
  while(true) {
   test.execute();
  }  
 }
 
 public void execute() {
        long N = 5 * 1000 * 1000;
        RandomStringUtils randomStringUtils = new RandomStringUtils();
        long ts = 0,tf = 0;
        long timer1 = 0;
        long timer2 = 0;
        long bs = System.nanoTime();
        for (long i = 0; i < N; i++) {
         ts = trackTime ? System.nanoTime() : 0;
            String text = randomStringUtils.generate();
            tf = trackTime ? System.nanoTime() : 0;
            timer1 += tf - ts;
            ts = tf;
   crypt(text);
   tf = trackTime ? System.nanoTime() : 0;
   timer2 += tf - ts;
   ts = tf;
        }
        long bt = System.nanoTime() - bs;
        System.out.print(String.format("Hash rate: %.2f Mm/s", 0.01 * (N * TimeUnit.SECONDS.toNanos(1) / bt / 10000)));
        if (trackTime) {
         System.out.print(String.format(" | Generation: %.1f %%",  0.1 * (1000 * timer1 / (timer1 + timer2))));
         System.out.print(String.format(" | Hashing: %.1f %%", 0.1 * (1000 * timer2 / (timer1 + timer2))));
        }
        System.out.println();
 }

    public String crypt(String str) {
        if (str == null || str.length() == 0) {
            throw new IllegalArgumentException("String to encrypt cannot be null or zero length");
        }
        StringBuilder hexString = new StringBuilder();
        try {
            MessageDigest md = MessageDigest.getInstance("MD5");
            md.update(str.getBytes());
            byte[] hash = md.digest();
            for (byte aHash : hash) {
                if ((0xff & aHash) < 0x10) {
                    hexString.append("0" + Integer.toHexString((0xFF & aHash)));
                } else {
                    hexString.append(Integer.toHexString(0xFF & aHash));
                }
            }
        } catch (NoSuchAlgorithmException e) {
            e.printStackTrace();
        }
        return hexString.toString();
    }
}
code is available on github

Now let’s use a Visual VM (a profiler bundled with Java 8) and look how much time is actually spent in CryptoBench.crypt() method.

Something in definitely off in screenshot above!

CryptoBench.crypt(), method doing actual cryptography, is attributed only to 33% of execution time.
At same time, CryptoBench.execute() has 67% of self time, and that methods is doing nothing besides calling other methods.

Probably I just need a cooler profiler here. /s

Let’s use Java Flight Recorder for the very same case.
Below is screen shot from Mission Control. 


That looks much better!

CryptoBench.crypt() is now 86% of time our budget. Rest of time code spends in random string generation.
These numbers are looking more belivable to me.

Wait, wait, wait!

Integer.toHexString() is taking as much time as actual MD5 calculation. I cannot belive that.

Numbers are better than ones produced by VisualVM but they are still fishy enough.

Flight recorder is not cool enough for that task! We need really cool profiler! /s

Ok, let me bring some sense into this discrepancy between tools.

We were using thread stack sampling in both tools (Visual VM and Flight Recorder). Though, these tools capture stack traces differently.

Visual VM is actually sampling thread dumps (via thread dump support in JVM). Thread dumps include stack traces for every application thread in JVM, regardless of whatever thread's state is (blocked, sleeping or actually executing code) and this dump is taken atomically. It reflects instant execution state of whole JVM (which is important for deadlock/contention analysis). In practice, that implies short Stop the World pause for each dump. Stop the World pause means safepoint in hotspot JVM. And safepoints brings some nuances.

When Visual VM requests thread dump, JVM notifies threads to suspend execution, but a thread executing Java code wouldn’t stop immediately (unless it is interpreted). The thread would continue to run until next safepoint check where it can suspend itself. Checks cost CPU cycles so they are sparse in JIT generated code.

Checks are placed inside of loops and after method returns. Though, checks are omitted for loops considered “fast” by JIT compiler (typically integer indexed loops). Small methods are aggressively inlined too, hence omiting safepoint check at return. As a consequence, a hot and calculation intensive code may be optimized by JIT into single chunk of machine code which is mostly free of safepoint checks.

If you are lucky, thread dump would show you a line invoking the method containing hot code. With less luck result would be even more misleading.

So in Visual VM call tree we see method CryptoBench.execute() at top of the stack for 66% of samples. If we would be able to see call tree at line number granularity is would be a line calling CryptoBench.crypt() method.

Bad, ugly safepoint bias I’ve caught you red handed! /s

So, how Flight Recorder does sample stacks and why numbers are different?

Flight Recorder sampling doesn’t involve full thread dumps. Instead it freezes threads one by one using OS provided facilities. Once thread is frozen; we can get address of next instruction to be executed out of stack memory area. Address of instruction is converted into line number of java source code via byte code to machine code symbol map. The map is generated during JIT compilation. This is how stack trace is reconstructed.

In case of Flight Recorder safepoint bias does not apply. Though results are still looking inaccurate. Why?

Below is another session with Flight Recorder for the very same code.


Picture is different now.

Integer.toHexString() is just 2.25% of out execution budget which is more trustworthy in my eyes.

Flight Recoder has to resolve memory addresses back to reference of bytecode instruction (which is further transalted into Java source line). Mapping generated by JIT compiler is used for that purpose.

Though compiler is aware that we can see thread stack trace only at safepoints. By default, only safepoint checks are mapped into bytecode instruction indexes. Flight Recorder takes execution address from stack, then it finds next address mapped to Java code in symbol table. In case of aggressive inlining, Flight Recorder can map address to whole wrong point in code.

Though sampling itself is not biased by safepoints, symbol map generated by JIT compiler is.

In second example, I’ve used two JVM options to force more detailed symbol maps to be generated by JIT compler. Options are below.

-XX:+UnlockDiagnosticVMOptions -XX:+DebugNonSafepoints

More accurate, free of bias, symbol map allows Flight Recorder to produce more accurate stack traces.

In our mental model, code is being executed line by line (bytecode instruction by instruction). But complier lumps bunch of methods together and generates single blob of machine code, aggressively reordering operations in the middle of process to make code faster.
Our mental model of line by line execution is totally broken by compiler optimization.

Though, in practice artifacts of operation reordering are not that striking as safepoint bias.

So Java Flight Recorder is cool, Visual VM is not. Should I make this conclusion?

Let me present a counter example.

Case 2

Below is profiling reports from a differnt case.

Now I’m using flame graph generated from data captured by Visual VM and Flight Recorder (with –XX:+DebugNonSafepoints).

Visual VM report 


Flight Recorder report 

Both graphs are showing InflaterInputStream to be a bottleneck. Though Visual VM assesses time spent as 98%, but in Flight Recorder it is just 47%.

Who is right?

Correct answer is 92% (which is approximated using differential analysis).

My heart is broken! Flight Recorder is not a silver bullet. /s

What have gone wrong?

In this example, hot spot was related to JNI overhead involved with calling native code in zlib. It seems like Flight Recorder were unable reconstruct stack trace for certain samples outside of Java code and dropped these samples. Sample population was biased by native code execution. That bias has played against Flight Recorder in this case.

Conclusion

Both profilers are doing that they intended to do. Some sort of bias is natural for almost any kind of sampling.

Each sampling profiler could be categorized by three aspects.

  • Blind spots bias – which samples are excluded from data set collected by profiler.
  • Attractor bias – how samples be attracted to specific discrete points (e.g. safe point).
  • Resolution – unit of code which profiling data is being aggregated to (e.g. method, line number etc).

Below is summary table for sampling methods mentioned in this article.

Blind spot Attractor Resolution
JVM Thread Dump Sampling non-java threads safepoint bias java frames only
Java Flight Recorder non-java code execution CPU pipeline bias
+ code to source mapping skew
java frames only
Java Flight Recorder
+ DebugNonSafepoint
non-java code execution CPU pipeline bias
+ code to source mapping skew
java frames only


Sunday, January 24, 2016

Flame Graphs Vs. Cold Numbers

Stack trace sampling is very powerful technique for performance troubleshooting. Advantages of stack trace sampling are

  • it doesn't require upfront configuration
  • cost added by sampling is small and controllable
  • it is easy to compare analysis result from different experiments

Unfortunately, tools offered for stack trace analysis by widespread Java profilers are very limited.

Solving performance problem in complex applications (a lot of business logic etc) is one of my regular challenges. Let's assume I have another misbehaving application at my hands. First step would be to localize bottleneck to specific part of stack.

Meet call tree

Call tree is built by digesting large number of stack traces. Each node in tree has a frequency - number of traces passing though this node.

Usually tools allow you to navigate through call tree reconstructed from stack trace population.

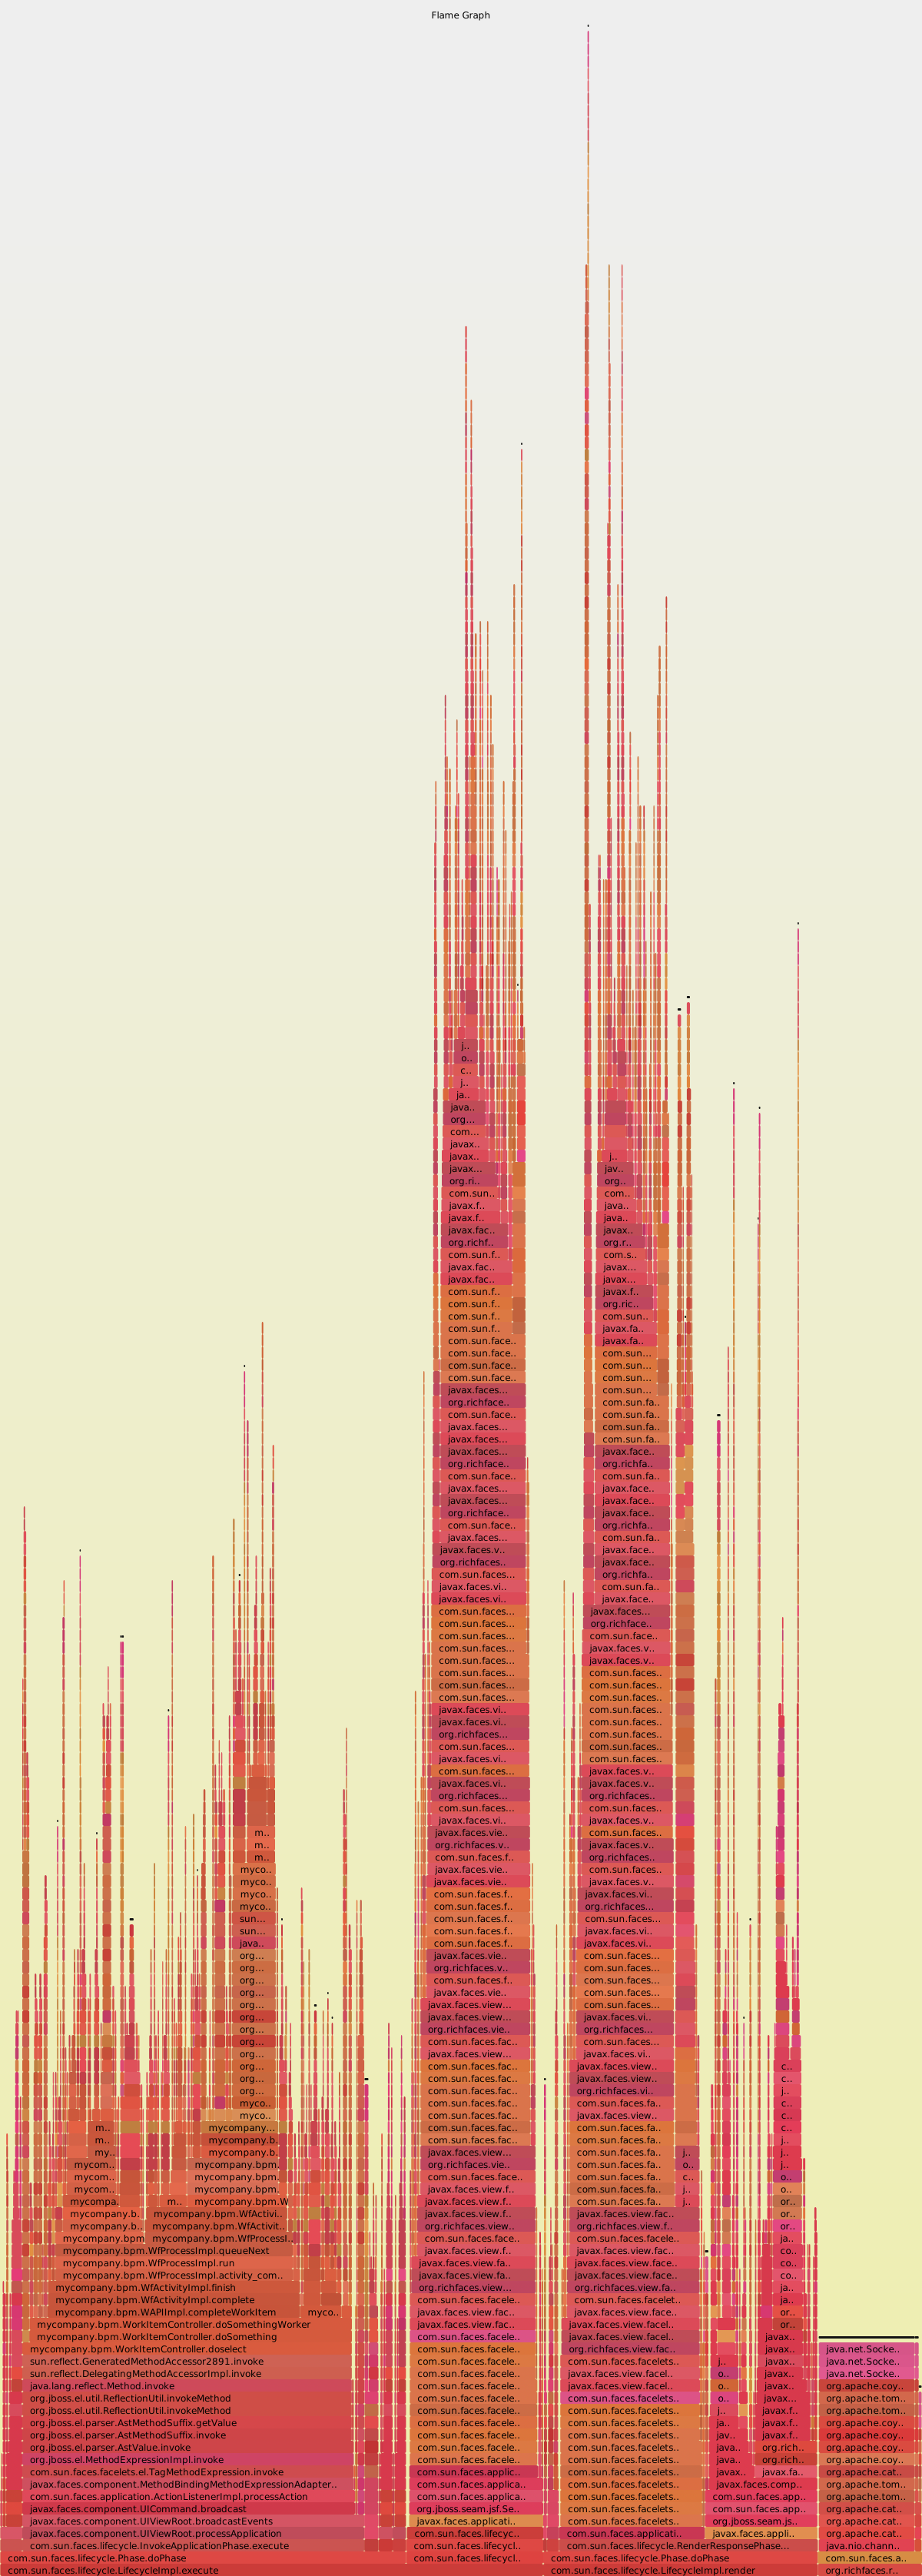
There is also flame graphs visualization (shown at right top of page) which is fancier but is just the same tree.

Looking at these visualization what can I see? - Not too much.

Why? Business logic somewhere in the middle of call tree produces too many branches. Tree beneath business logic is blurred beyond point of usability.

Dissecting call tree

Application is build using frameworks. For the sake of this article, I'm using example based on JBoss, JSF, Seam, Hibernate.

Now, if 13% of traces in our dump contain JDBC we can conclude what 13% of time is spent in JDBC / database calls.
13% is reasonable number, so database is not to blame here.

Let's go down the stack, Hibernate is next layer. Now we need to calculate all traces containing Hibernate classes excluding ones containing JDBC. This way we can attribute traces to particular framework and quickly get a picture where time is spent at runtime.

I didn't find any tool that can do it kind of analysis for me, so I build one for myself few years ago. SJK is my universal Java troubleshooting toolkit.

Below is command doing analysis explained above.

sjk ssa -f tracedump.std  --categorize -tf **.CoyoteAdapter.service -nc
JDBC=**.jdbc 
Hibernate=org.hibernate
"Facelets compile=com.sun.faces.facelets.compiler.Compiler.compile"
"Seam bijection=org.jboss.seam.**.aroundInvoke/!**.proceed"
JSF.execute=com.sun.faces.lifecycle.LifecycleImpl.execute
JSF.render=com.sun.faces.lifecycle.LifecycleImpl.render
Other=**

Below is output of this command.

Total samples    2732050 100.00%
JDBC              405439  14.84%
Hibernate         802932  29.39%
Facelets compile  395784  14.49%
Seam bijection    385491  14.11%
JSF.execute       290355  10.63%
JSF.render        297868  10.90%
Other             154181   5.64%

Well, we clearly see a large amount of time spent in Hibernate. This is very wrong, so it is first candidate for investigation. We also see that a lot of CPU is spent on JSF compilation, though pages should be compiled just once and cached (it turned out to be configuration issue). Actual application logic falls in JFS life cycle calls (execute(), render()). I would be possible to introduce additional category to isolate pure application logic execution time, but looking at numbers, I would say it is not necessary until other problems are solved.

Hibernate is our primary suspect, how to look inside? Let's look at method histogram for traces attributed to Hibernate trimming away all frames up to first Hibernate method call.

Below is command to do this.

sjk ssa -f --histo -tf **!**.jdbc -tt ogr.hibernate

Here is top of histogram produced by command

Trc     (%)  Frm  N  Term    (%)  Frame                                                                                                                                                                                  
699506  87%  699506       0   0%  org.hibernate.internal.SessionImpl.autoFlushIfRequired(SessionImpl.java:1204)                                                                                                          
689370  85%  689370      10   0%  org.hibernate.internal.QueryImpl.list(QueryImpl.java:101)                                                                                                                              
676524  84%  676524       0   0%  org.hibernate.event.internal.DefaultAutoFlushEventListener.onAutoFlush(DefaultAutoFlushEventListener.java:58)                                                                          
675136  84%  675136       0   0%  org.hibernate.internal.SessionImpl.list(SessionImpl.java:1261)                                                                                                                         
573836  71%  573836       4   0%  org.hibernate.ejb.QueryImpl.getResultList(QueryImpl.java:264)                                                                                                                          
550968  68%  550968       1   0%  org.hibernate.event.internal.AbstractFlushingEventListener.flushEverythingToExecutions(AbstractFlushingEventListener.java:99)                                                          
533892  66%  533892     132   0%  org.hibernate.event.internal.AbstractFlushingEventListener.flushEntities(AbstractFlushingEventListener.java:227)                                                                       
381514  47%  381514     882   0%  org.hibernate.event.internal.AbstractVisitor.processEntityPropertyValues(AbstractVisitor.java:76)                                                                                      
271018  33%  271018       0   0%  org.hibernate.event.internal.DefaultFlushEntityEventListener.onFlushEntity(DefaultFlushEntityEventListener.java:161)

Here is our suspect. We spent 87% of Hibernate time in autoFlushIfRequired() call (and JDBC time is already excluded).

Using few commands we have narrowed down one performance bottleneck. Fixing it is another topic though.

In a case, I'm using as example, CPU usage of application were reduced by 10 times. Few problems found and addressed during that case were

  • optimization of Hibernate usage
  • facelets compilation caching were properly configure
  • work around performance bug in Seam framework was implemented
  • JSF layouts were optimized to reduce number of Seam injections / outjections

Limitations of this approach

During statistical analysis of stack traces you deal with wallclock time, you cannot guest real CPU time using this method. If CPU on host is saturated, your number will be skewed by the threads idle time due to CPU starvation.

Normally you can get stack trace only at JVM safepoints. So if some methods are inlined by JIT compiler, they may never appear at trace even if they are really busy. In other words, tip of stack trace may be skewed by JIT effects. Practically, it was never an obstacle for me, but you should be keep in mind possibility of such effect.

What about flame graphs?

Well, despite being not so useful, they look good on presentations. Support for flame graphs was added to SJK recently.

Update

After some time, I've found my self using flame graphs very actively. Yes, for certain situation this type of visualization doesn't make sense, but as a first bird eye look at the problem flame graphs are indispensable.

Tuesday, August 4, 2015

SJK - missing link in Java profiling tool chain

Sometimes it just happens. You have a bloated Java application at your hand and it does not perform well. You may have built this application yourself or just got it as it is now. It doesn't matter, thing is - you do not have a slightest idea what is wrong here.

Java ecosystem have abundance of diagnostic tools (thank for interfaces exposed at JVM itself), but they are mostly focused on some specific narrow kinds of problems. Despite calling themselves intuitive, they assume you have a lot of background knowledge about JVM and profiling techniques. Honestly, even seasoned Java (I'm speaking for myself here) developer can feel lost first time looking at JProfiler, YourKit of Mission Control.

If you have a performance problem at your hand, first you need is to classify problem: is it in Java or database or somewhere else? is CPU or memory kind of problem? Once you know what kind of problem you have, you can choose next diagnostic approach consciously.

Are we CPU bound?

One of first thing you would naturally do is to check CPU usage of your process. OS can show you process CPU usage. Which is useful, but the next question is which threads are consuming it. OS can show you threads usage too, you can even get OS IDs for your Java threads using jstack and correlate them ... manually (sick).

A simple tool showing CPU usage per Java thread is the thing I wanted badly for the years.

Surprisingly, all information is already in JMX Threading MBean. All is left is to do trivial math and report per thread CPU usage. So I just did it and ttop command become first in SJK tool set.

Besides CPU usage JMX have another invaluable metric - per thread allocation counter.

Collecting information from JMX is safe and can be done on live application instance (in case if you do not have JMX port open, SJK can connect using process ID).

Below is example of ttop command output.

2014-10-01T19:27:22.825+0400 Process summary
  process cpu=101.80%
  application cpu=100.50% (user=86.21% sys=14.29%)
  other: cpu=1.30%
  GC cpu=0.00% (young=0.00%, old=0.00%)
  heap allocation rate 123mb/s
  safe point rate: 1.5 (events/s) avg. safe point pause: 0.14ms
  safe point sync time: 0.00% processing time: 0.02% (wallclock time)
[000037] user=83.66% sys=14.02% alloc=  121mb/s - Proxy:ExtendTcpProxyService1:TcpAcceptor:TcpProcessor
[000075] user= 0.97% sys= 0.08% alloc=  411kb/s - RMI TCP Connection(35)-10.139.200.51
[000029] user= 0.61% sys=-0.00% alloc=  697kb/s - Invocation:Management
[000073] user= 0.49% sys=-0.01% alloc=  343kb/s - RMI TCP Connection(33)-10.128.46.114
[000023] user= 0.24% sys=-0.01% alloc=   10kb/s - PacketPublisher
[000022] user= 0.00% sys= 0.10% alloc=   11kb/s - PacketReceiver
[000072] user= 0.00% sys= 0.07% alloc=   22kb/s - RMI TCP Connection(31)-10.139.207.76
[000056] user= 0.00% sys= 0.05% alloc=   20kb/s - RMI TCP Connection(25)-10.139.207.76
[000026] user= 0.12% sys=-0.07% alloc=  2217b/s - Cluster|Member(Id=18, Timestamp=2014-10-01 15:58:3 ...
[000076] user= 0.00% sys= 0.04% alloc=  6657b/s - JMX server connection timeout 76
[000021] user= 0.00% sys= 0.03% alloc=   526b/s - PacketListener1P
[000034] user= 0.00% sys= 0.02% alloc=  1537b/s - Proxy:ExtendTcpProxyService1
[000049] user= 0.00% sys= 0.02% alloc=  6011b/s - JMX server connection timeout 49
[000032] user= 0.00% sys= 0.01% alloc=     0b/s - DistributedCache

Besides CPU and allocation, it also collect "true" GC usage and safe point statistics. Later two metrics are not available via JMX so they are available only for process ID connections.

CPU usage picture will give you good insight what to do next: should you profile your Java hot spots or all time is spent waiting result from DB.

Garbage analysis

Another common class of Java problems is related to garbage collection. If this is a case GC logs is first place to look at.

Do you have them enabled? If not, that is not a big deal, you can enable GC logging on running JVM process using jinfo command. You can also use SJK's gc command to peek GC activity for your java process (it is not as full as GC logs tough).

If GC logs confirm what GC is causing you problems, next step is to identify where that garbage comes from.

Commercial profilers are good at memory profiling, but this kind of analysis slows down target application dramatically.

Mission Control stands out of pack here, it can profile by sampling TLAB allocation failures. This technique is cheap and generally produce good results, though it is inherently biased and may mislead you sometimes.

For long time jmap and class histogram were main memory profiling instrument for me. Class histogram is simple and accurate.

In SJK] toolset, I have augmented vanila jmap command a little to make it more useful (SJK's [hh command).

Beware that jmap (and thus hh command) required Stop the World pause on target JVM while heap is being walked, so it may not be a good idea to execute it against live application under load.

Dead heap histogram is calculated as difference between object population before and after forced GC (using jmap class histogram command under hood).

Dead young heap histogram enforces full GC then wait 10 seconds (by default) then produce dead object histogram by technique describe above. Thus you see a summary freshly allocated garbage.

This methods cannot not tell you where in your code that garbage was allocated (this is job for Mission Control et al ). Though, if you know that is your top garbage objects, you may already know there they are allocated.

SJK have a few more tools but these two ttop and hh are always in front lines when I need to tackle another performance related problem.