Thursday, September 21, 2023

Curse of the JMX

JMX stands for Java Management Extension, it was introduced as part Java Enterprise Edition (JEE) and later has become an integral part of JVM.

JVM exposes a handful of useful information on diagnostic tooling through the JMX interface.

Many popular tools such as Visual VM and Mission Control are heavily based on JXM. Event Java Flight Record is exposed for remote connection via JMX.

Middleware and libraries are also exploiting JMX to expose custom MBeans with helpful information.

So if you are in the business of JVM monitoring or diagnostic tooling you cannot avoid dealing with JMX.

JMX is a remote access protocol, it is using TCP sockets and requires some upfront configuration for JVM to start listening for network connections (though tools such as VisualVM can enable JMX at runtime, provided they have access to the JVM process).

You can find details about JMX agent configuration in official documentation, but below is minimal configuration (add snippet below to JVM start command).

-Dcom.sun.management.jmxremote -Dcom.sun.management.jmxremote.authenticate=false -Dcom.sun.management.jmxremote.ssl=false -Dcom.sun.management.jmxremote.port=55555

JVM will start listening on port 5555. You would be able to use this port in Visual VM and other tools.

Configuration above is minimal, access control and TLS encryption are disabled. You should consult documentation mentioned above to add security (which would be typically required in a real environment).

JMX is a capable protocol, but it has some idiosyncrasies due to its JEE lineage. In particular, it has specific requirements for network topology.

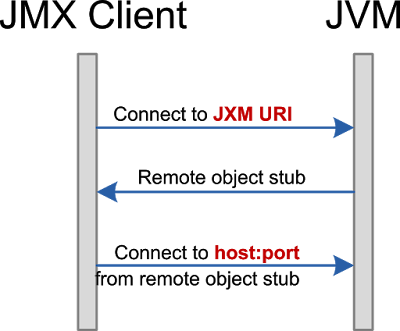
JVM is based on Java RMI protocol. Access to JMX agent has a two step handshake.

On the first step, the client makes a request to the RMI registry and receives a serialized remote interface stub.  JXM agent has a built-in single object registry which is exposed on port 5555 in our example.

On the second step, client to accessing remote interface via network address embedded in this stub object received on the first step.

In a trivial network, this is not an issue, but if there are any form of NAT or proxy between JMX client and JVM things are likely to break.

So we have two issues here:

1.    Stub could be exposed on different port number, which is not whitelisted

2.    Stub may provide some kind of internal IP, not routable for client host

First issue is easily solvable with com.sun.management.jmxremote.rmi.port property, which can be set to the same value as registry port (5555 in our example).

Second issue is much more tricky as JVM may be totally unaware of IP visible from outside, even worse such IP could be dynamic so it cannot be configured via JVM command line.

In this article, I would describe a few recipes for dealing with JMX in the modern container/cloud world. None of them is ideal, but I hope at least one could be useful for you.

Configuring JMX for known external IP address

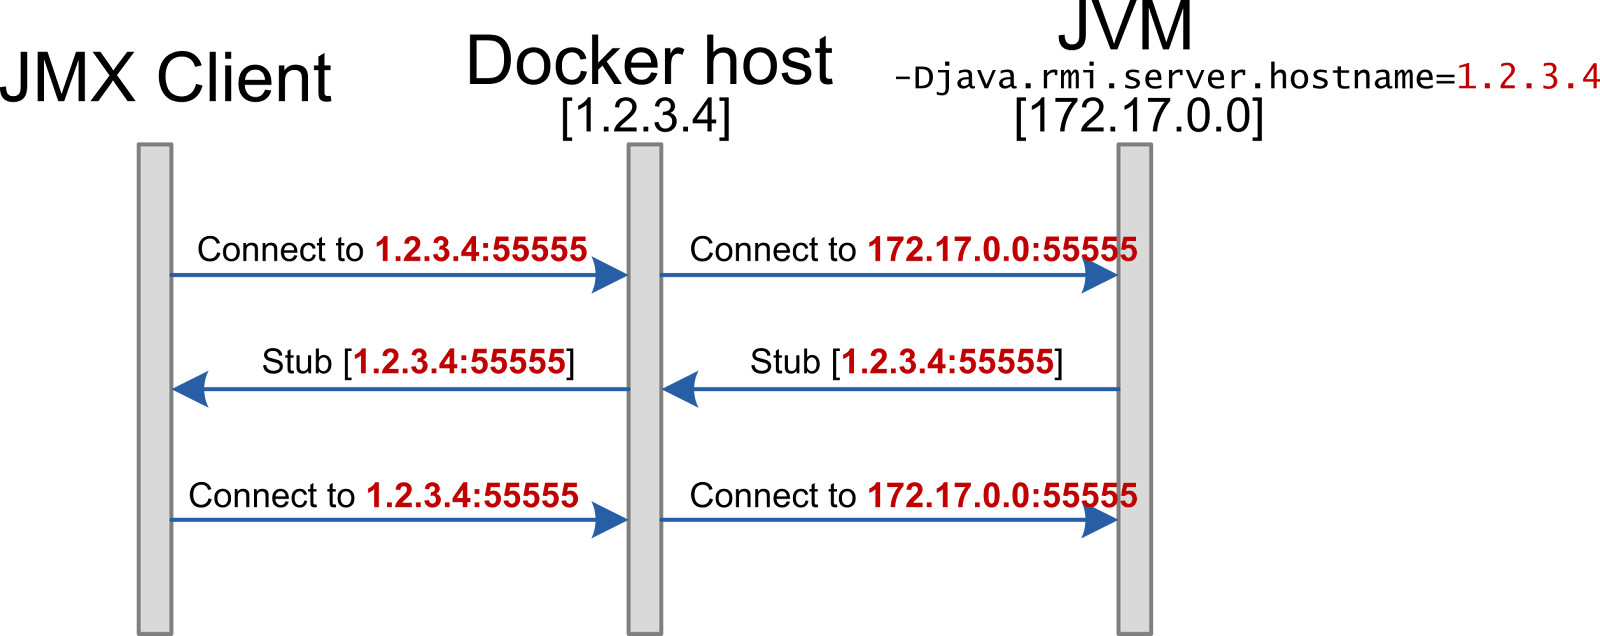
In case if you know a routable IP address, the solution is to configure the JVM to provide specific IP inside of the remote interface stub. Example for this situation would be running a JVM in a local Docker container.

JVM parameter -Djava.rmi.server.hostname=<MyHost> can be used to override IP in remote stubs provided by JMX agent. This parameter affects all RMI communication, but RMI is rarely used nowadays besides the JXM protocol.

Resulting communication scheme is outlined on the diagram below.

JVM options

-Djava.rmi.server.hostname=1.2.3.4
-Dcom.sun.management.jmxremote
-Dcom.sun.management.jmxremote.authenticate=false
-Dcom.sun.management.jmxremote.ssl=false
-Dcom.sun.management.jmxremote.port=55555
-Dcom.sun.management.jmxremote.rmi.port=5555

Communication diagram

Configuring JMX for tunneling

In some situations, the IP address of the JVM host may not be even reachable from the JMX client host. Here is a couple of typical examples

     You are using SSH to access the internal network through a bastion host.

     JVM is in Kubernetes POD.

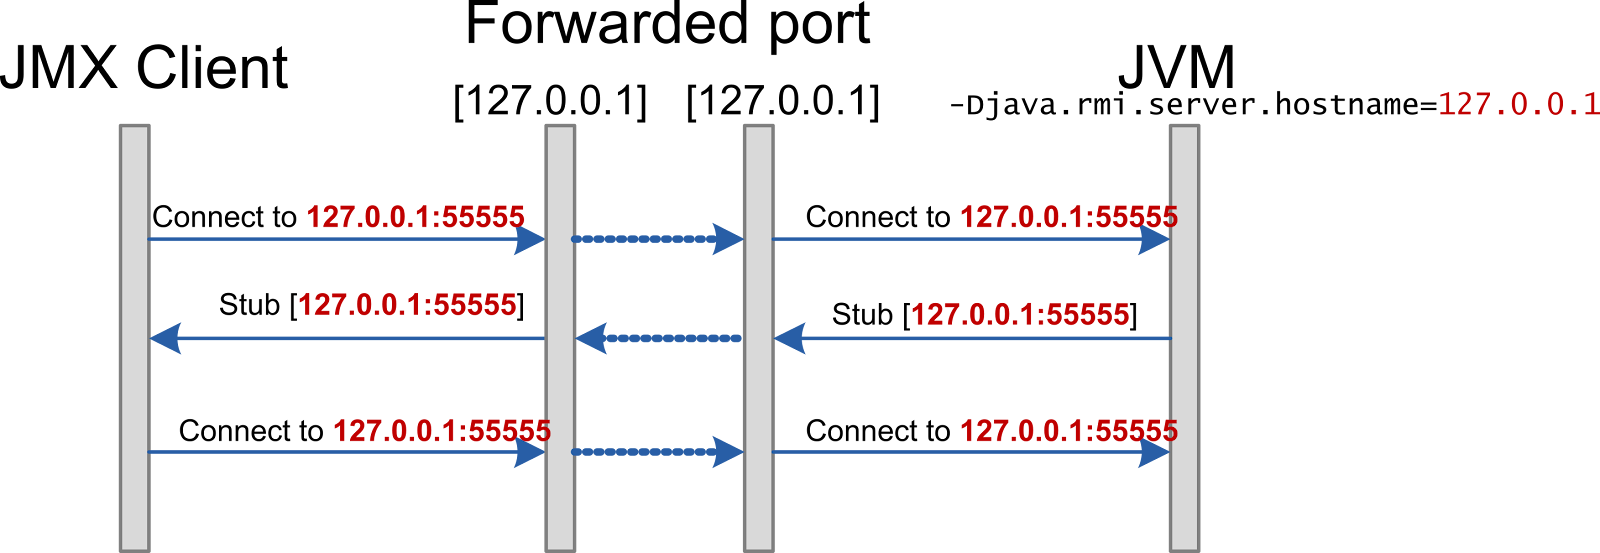
In both situations you can use port forwarding to establish a network connectivity between JMX client and JVM.

Again, you would need to override IP in remote service stub, but now you will have to set it to 127.0.0.1.

Communication diagram is shown below.

JVM options

-Djava.rmi.server.hostname=127.0.0.1
-Dcom.sun.management.jmxremote
-Dcom.sun.management.jmxremote.authenticate=false
-Dcom.sun.management.jmxremote.ssl=false
-Dcom.sun.management.jmxremote.port=55555
-Dcom.sun.management.jmxremote.rmi.port=5555

Communication diagram

In the case of SSH, you can use port forwarding.
In Kubernetes, there is also a handy
kubectl port-forward command which allows to communicate with POD directly.

You can even chain port-forwarding multiple times.

Though this approach has its own limitations.

     JMX will not be available for remote hosts without port forwarding any more, so this configuration may interfere with monitoring agents running in your cluster and collecting JMX metrics.

     You cannot connect to multiple JVMs using the same JMX port (e.g. PODs from single deployment), as your port on client host is bound to a particular remote destination. Remapping ports will break the JMX.

Using HTTP JMX connector

Root of the problem is the RMI protocol which is archaic and doesn’t evolve to support modem network topologies. JMX is flexible enough to use alternative transport layers and one of them is HTTP (using Jolokia open source project).

Though implementation doesn’t come out of the box. You will have to ship a Jolokia agent jar with your application and introduce it via JVM command like Java agent (see details here).

Good news is that nowadays tools such as VisualVM and Mission Control fully support Jolokia JMX transport. Below are few demo videos for Jolokia project:

     Jolokia from JMC

     Connect Visual VM to a JVM running in Kubernetes using Jolokia

     Connect Java Mission Control to a JVM in Kubernetes

In addition to classic tools, Jolokia HTTP endpoint is accessible from client side JavaScript so web client is also possible. See Hawt.IO project implement diagnostic web console for Java on top of Jolokia.

Using SJK JMX proxy

Dealing with JMX over the years, at some point I have decided to make a diagnostic tool specifically for JMX connectivity troubleshooting.

It is part of SJK - my jack-of-all-knives solution for dealing with JVM diagnostics. mxping command can help to identify, which part of JMX handshake is broken.

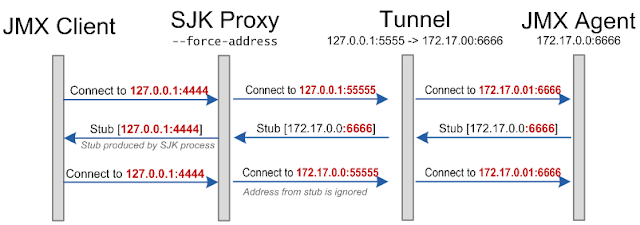
While implementing mxping, I have realized that I can solve the root cause of RMI network sensitivity by messing with JMX client code. As I am not eager to patch all JMX tools around, I have introduced JMX Proxy (mxprx), which can be used between JMX Client and remote JVM.

Using JMX proxy may eliminate issues with port forwarding scenario mention above as

     It does require -Djava.rmi.server.hostname=127.0.0.1 on the JVM side.

     Allow you remap ports and thus keep multiple ports forwarded at the same time.

Below is a communication diagram using JMX proxy from SJK.

In addition, with JMX proxy ad hoc configuration of JMX endpoint without JVM restart becomes possible.

JMX agent could be started and configured at runtime via jcmd, but java.rmi.server.hostname can only be set in the command line of the JVM. But with JMX proxy we do not rely on java.rmi.server.hostname anymore!

Below are steps to connect to the JVM in the Kubernetes POD even if JMX was not configured upfront.

1.    Enter the container shell using the kubectl exec command.

2.    In the container, use jcmd ManagementAgent.start to start JMX agent (see more details here).

3.    Forward port from container to your local host.

4.    Start JMX proxy on your host pointing it on localhost:<port forwarded from container> and provide some outbound port (see more details here).

5.    Now you can connect with any JMX aware tool via locally running JMX proxy.

Conclusion

I have listed four alternative approaches for JMX setup. None of them are universal unfortunately and you have to pick one which is most suitable for your case.

While JMX is kind of archaic it is still essential for JVM monitoring and you are likely to have to deal with it for any serious Java based system.

I hope someday HTTP will become built-in and default for JVM and all this trickery will become a horror story from the old days.

Monday, March 11, 2019

Lies, darn lies and sampling bias

Sampling profiling is very powerful technique widely used across various platforms for identifying hot code (execution bottlenecks).

In Java world sampling profiling (thread stack sampling to be precise) is supported by every serious profiler.

While being powerful and very handy in practice, sampling has well known weakness – sampling bias. It is real and well-known problem, though its practical impact is often being over exaggerated.

A picture is worth a thousand of words, so let me jump start with example.

Case 1

Below is a simple snippet of code. This snippet is doing cryptographic hash calculation over a bunch of random strings.

import java.security.MessageDigest;
import java.security.NoSuchAlgorithmException;
import java.util.concurrent.TimeUnit;

public class CryptoBench {

 private static final boolean trackTime = Boolean.getBoolean("trackTime");
 
 public static void main(String[] args) {
  CryptoBench test = new CryptoBench();
  while(true) {
   test.execute();
  }  
 }
 
 public void execute() {
        long N = 5 * 1000 * 1000;
        RandomStringUtils randomStringUtils = new RandomStringUtils();
        long ts = 0,tf = 0;
        long timer1 = 0;
        long timer2 = 0;
        long bs = System.nanoTime();
        for (long i = 0; i < N; i++) {
         ts = trackTime ? System.nanoTime() : 0;
            String text = randomStringUtils.generate();
            tf = trackTime ? System.nanoTime() : 0;
            timer1 += tf - ts;
            ts = tf;
   crypt(text);
   tf = trackTime ? System.nanoTime() : 0;
   timer2 += tf - ts;
   ts = tf;
        }
        long bt = System.nanoTime() - bs;
        System.out.print(String.format("Hash rate: %.2f Mm/s", 0.01 * (N * TimeUnit.SECONDS.toNanos(1) / bt / 10000)));
        if (trackTime) {
         System.out.print(String.format(" | Generation: %.1f %%",  0.1 * (1000 * timer1 / (timer1 + timer2))));
         System.out.print(String.format(" | Hashing: %.1f %%", 0.1 * (1000 * timer2 / (timer1 + timer2))));
        }
        System.out.println();
 }

    public String crypt(String str) {
        if (str == null || str.length() == 0) {
            throw new IllegalArgumentException("String to encrypt cannot be null or zero length");
        }
        StringBuilder hexString = new StringBuilder();
        try {
            MessageDigest md = MessageDigest.getInstance("MD5");
            md.update(str.getBytes());
            byte[] hash = md.digest();
            for (byte aHash : hash) {
                if ((0xff & aHash) < 0x10) {
                    hexString.append("0" + Integer.toHexString((0xFF & aHash)));
                } else {
                    hexString.append(Integer.toHexString(0xFF & aHash));
                }
            }
        } catch (NoSuchAlgorithmException e) {
            e.printStackTrace();
        }
        return hexString.toString();
    }
}
code is available on github

Now let’s use a Visual VM (a profiler bundled with Java 8) and look how much time is actually spent in CryptoBench.crypt() method.

Something in definitely off in screenshot above!

CryptoBench.crypt(), method doing actual cryptography, is attributed only to 33% of execution time.
At same time, CryptoBench.execute() has 67% of self time, and that methods is doing nothing besides calling other methods.

Probably I just need a cooler profiler here. /s

Let’s use Java Flight Recorder for the very same case.
Below is screen shot from Mission Control. 


That looks much better!

CryptoBench.crypt() is now 86% of time our budget. Rest of time code spends in random string generation.
These numbers are looking more belivable to me.

Wait, wait, wait!

Integer.toHexString() is taking as much time as actual MD5 calculation. I cannot belive that.

Numbers are better than ones produced by VisualVM but they are still fishy enough.

Flight recorder is not cool enough for that task! We need really cool profiler! /s

Ok, let me bring some sense into this discrepancy between tools.

We were using thread stack sampling in both tools (Visual VM and Flight Recorder). Though, these tools capture stack traces differently.

Visual VM is actually sampling thread dumps (via thread dump support in JVM). Thread dumps include stack traces for every application thread in JVM, regardless of whatever thread's state is (blocked, sleeping or actually executing code) and this dump is taken atomically. It reflects instant execution state of whole JVM (which is important for deadlock/contention analysis). In practice, that implies short Stop the World pause for each dump. Stop the World pause means safepoint in hotspot JVM. And safepoints brings some nuances.

When Visual VM requests thread dump, JVM notifies threads to suspend execution, but a thread executing Java code wouldn’t stop immediately (unless it is interpreted). The thread would continue to run until next safepoint check where it can suspend itself. Checks cost CPU cycles so they are sparse in JIT generated code.

Checks are placed inside of loops and after method returns. Though, checks are omitted for loops considered “fast” by JIT compiler (typically integer indexed loops). Small methods are aggressively inlined too, hence omiting safepoint check at return. As a consequence, a hot and calculation intensive code may be optimized by JIT into single chunk of machine code which is mostly free of safepoint checks.

If you are lucky, thread dump would show you a line invoking the method containing hot code. With less luck result would be even more misleading.

So in Visual VM call tree we see method CryptoBench.execute() at top of the stack for 66% of samples. If we would be able to see call tree at line number granularity is would be a line calling CryptoBench.crypt() method.

Bad, ugly safepoint bias I’ve caught you red handed! /s

So, how Flight Recorder does sample stacks and why numbers are different?

Flight Recorder sampling doesn’t involve full thread dumps. Instead it freezes threads one by one using OS provided facilities. Once thread is frozen; we can get address of next instruction to be executed out of stack memory area. Address of instruction is converted into line number of java source code via byte code to machine code symbol map. The map is generated during JIT compilation. This is how stack trace is reconstructed.

In case of Flight Recorder safepoint bias does not apply. Though results are still looking inaccurate. Why?

Below is another session with Flight Recorder for the very same code.


Picture is different now.

Integer.toHexString() is just 2.25% of out execution budget which is more trustworthy in my eyes.

Flight Recoder has to resolve memory addresses back to reference of bytecode instruction (which is further transalted into Java source line). Mapping generated by JIT compiler is used for that purpose.

Though compiler is aware that we can see thread stack trace only at safepoints. By default, only safepoint checks are mapped into bytecode instruction indexes. Flight Recorder takes execution address from stack, then it finds next address mapped to Java code in symbol table. In case of aggressive inlining, Flight Recorder can map address to whole wrong point in code.

Though sampling itself is not biased by safepoints, symbol map generated by JIT compiler is.

In second example, I’ve used two JVM options to force more detailed symbol maps to be generated by JIT compler. Options are below.

-XX:+UnlockDiagnosticVMOptions -XX:+DebugNonSafepoints

More accurate, free of bias, symbol map allows Flight Recorder to produce more accurate stack traces.

In our mental model, code is being executed line by line (bytecode instruction by instruction). But complier lumps bunch of methods together and generates single blob of machine code, aggressively reordering operations in the middle of process to make code faster.
Our mental model of line by line execution is totally broken by compiler optimization.

Though, in practice artifacts of operation reordering are not that striking as safepoint bias.

So Java Flight Recorder is cool, Visual VM is not. Should I make this conclusion?

Let me present a counter example.

Case 2

Below is profiling reports from a differnt case.

Now I’m using flame graph generated from data captured by Visual VM and Flight Recorder (with –XX:+DebugNonSafepoints).

Visual VM report 


Flight Recorder report 

Both graphs are showing InflaterInputStream to be a bottleneck. Though Visual VM assesses time spent as 98%, but in Flight Recorder it is just 47%.

Who is right?

Correct answer is 92% (which is approximated using differential analysis).

My heart is broken! Flight Recorder is not a silver bullet. /s

What have gone wrong?

In this example, hot spot was related to JNI overhead involved with calling native code in zlib. It seems like Flight Recorder were unable reconstruct stack trace for certain samples outside of Java code and dropped these samples. Sample population was biased by native code execution. That bias has played against Flight Recorder in this case.

Conclusion

Both profilers are doing that they intended to do. Some sort of bias is natural for almost any kind of sampling.

Each sampling profiler could be categorized by three aspects.

  • Blind spots bias – which samples are excluded from data set collected by profiler.
  • Attractor bias – how samples be attracted to specific discrete points (e.g. safe point).
  • Resolution – unit of code which profiling data is being aggregated to (e.g. method, line number etc).

Below is summary table for sampling methods mentioned in this article.

Blind spot Attractor Resolution
JVM Thread Dump Sampling non-java threads safepoint bias java frames only
Java Flight Recorder non-java code execution CPU pipeline bias
+ code to source mapping skew
java frames only
Java Flight Recorder
+ DebugNonSafepoint
non-java code execution CPU pipeline bias
+ code to source mapping skew
java frames only


Wednesday, May 30, 2018

SJK is learning new tricks

SJK or (Swiss Java Knife) was my secret weapon for firefighting various types of performance problems for long time.

A new version of SJK was released not too long ago and it contains а bunch of new and powerful features I would like to highlight.

ttop contention monitoring

SJK is living it's name by bundling a number of tool into single executable jar. Though, ttop is a likely single most commonly used tool under SJK roof.

ttop is a kind top for threads of JVM process. Besides CPU usage counter (provided by OS) and allocation rate (tracked by JVM), a new thread contention metrics was introduced in recent SJK release.

Thread contention metrics are calculated by JVM, which counts and times when Java threads enters into BLOCKED or WAITING state.

If enabled, SJK is using these metrics to display rates and percentage of time spent in either state.

2018-05-29T14:20:03.382+0300 Process summary 
  process cpu=231.09%
  application cpu=212.78% (user=195.86% sys=16.92%)
  other: cpu=18.31% 
  thread count: 157
  GC time=4.72% (young=4.72%, old=0.00%)
  heap allocation rate 976mb/s
  safe point rate: 6.3 (events/s) avg. safe point pause: 8.24ms
  safe point sync time: 0.07% processing time: 5.09% (wallclock time)
[000180] user=19.40% sys= 0.31% wait=183.6/s(75.77%) block=    0/s( 0.00%) alloc=  110mb/s - hz._hzInstance_2_dev.cached.thread-8
[000094] user=16.92% sys= 0.16% wait=58.50/s(81.54%) block=    0/s( 0.00%) alloc=   94mb/s - hz._hzInstance_3_dev.generic-operation.thread-0
[000057] user=15.05% sys= 0.62% wait=56.91/s(82.35%) block= 0.20/s( 0.01%) alloc=   91mb/s - hz._hzInstance_2_dev.generic-operation.thread-0
[000095] user=15.21% sys= 0.00% wait=55.61/s(82.32%) block= 0.30/s( 0.04%) alloc=   87mb/s - hz._hzInstance_3_dev.generic-operation.thread-1
[000022] user=14.59% sys= 0.00% wait=56.01/s(83.42%) block= 0.30/s( 0.08%) alloc=   86mb/s - hz._hzInstance_1_dev.generic-operation.thread-1
[000058] user=13.97% sys= 0.16% wait=56.91/s(84.13%) block= 0.10/s( 0.02%) alloc=   81mb/s - hz._hzInstance_2_dev.generic-operation.thread-1

An important fact about these metrics is - CPU time + WAITING + BLOCKED should be 100% in ideal world.

In reality, you a likely to see a gap. A few reason why equation above is not holding:

  • GC pauses are freezing thread execution, but not accounted by thread contention monitoring,
  • thread may be waiting for IO operation, but it is not accounted as BLOCKED or WAITING state by JVM,
  • system may starve on CPU resource and thread is waiting for CPU core on OS level (which is also not accounted by JVM).

Contention monitoring is not enabled by default, use -c flag with ttop command to enabled it.

HTML5 based flame graph

SJK was able to produce flame graphs for sometime already. Though, old flame graphs were generated as svg with limited interactivity.

New version offers a new type of flame graphs based on HTML5 and interactive. Right in browser it allows:

  • filtering data by threads,
  • zoom into specific paths or by presence of specific frame,
  • filtering data by thread state (if state information is available).

HTML5 report is 100% self contained file with no dependencies, it can sent it by email and open on any machine. Here is an example of new flame graph you can play right now.

New flame command is used to generate HTML5 flame graphs.

`jstack` dump support

SJK is accepting a number of input data formats for thread sampling data, which is used for flame graphs and other types of performance analysis.

A new format added in 0.10 version is text thread dump formats produced by jstack. Full list of input formats now:

  • SJK native thread sampling format
  • JVisualVM sampling snapshots (.nps)
  • Java Flight Recorder recording (.jfr)
  • jstack produced text thread dumps