Below are slide decks for open event held in Moscow Technology Center of Deutsche Bank.
Topic of event was garbage collection in JVM.
Part 1 by Alexey Ragozin
Part 2 by Alexander Ashitkin
Below are slide decks for open event held in Moscow Technology Center of Deutsche Bank.
Topic of event was garbage collection in JVM.
Part 1 by Alexey Ragozin
Part 2 by Alexander Ashitkin
Today I was speaking on Coherence SIG event in London.
My topic was "Filtering 100M objects. What can go wrong?". It was a story of solving particular problem and obstacles we have encountered. One noticeable thing about this project - out team was using Performance Test Driven Development approach.
We have started with simplest solution, then were focusing on problem identified by testing.
Slide deck from presentation is below.
Guardian was introduced in Oracle Coherence 3.5 as uniform and reliable mean to detect and report various stalls and hangs on data grid members. In addition to monitoring internal components of Coherence, Guardian has an API accessible for application developer.
While out-of-box Guardian does its job pretty well, there are few aspects you can improve.
There 3 techniques to work with Coherence Guardian. Your can choose to employ all of them or just few.
Guardian is using heartbeat mechanics to detect thread stalls. Internally Coherence code explicitly heartbeat in appropriate points in code. Application code could use similar technique if long execution time is expected. CacheStores are good example of this.
GuardSupport.heartbeat() – sends normal heartbeatGuardSupport.heartbeat(long) – allows you to pass expected time till next heartbeat (e.i. if you expect that SQL query to take several minutes, you could prevent log warning by passing reasonably long timeout before execution SQL statement)Normally the guardian would try to "recover" thread if no heartbeats were received during timeout (eigther specified in configuration or last heartbeat(...) call).
This behavior can be overridden though.
Application can register own Guardable and temporary disable monitoring of current thread.
Below is a code snippet which wraps cache loader operations in Guardable preventing thread interruption
(default way to "recover" worker thread).
public static class GuardianAwareCacheLoader implements CacheLoader {

    private CacheLoader loader;

    public GuardianAwareCacheLoader(CacheLoader loader) {
        this.loader = loader;
    }

    @Override
    public Object load(Object key) {
        GuardContext ctx = GuardSupport.getThreadContext();
        if (ctx != null) {
            KeyLoaderGuard guard = new KeyLoaderGuard(Collections.singleton(key));
            GuardContext klg = ctx.getGuardian().guard(guard);
            GuardSupport.setThreadContext(klg);
        }
        try {
            return loader.load(key);
        }
        finally {
            if (ctx != null) {
                GuardContext klg = GuardSupport.getThreadContext();
                GuardSupport.setThreadContext(ctx);
                klg.release();
            }
        }
    }

    @Override
    @SuppressWarnings({ "rawtypes", "unchecked" })
    public Map loadAll(Collection keys) {
        GuardContext ctx = GuardSupport.getThreadContext();
        if (ctx != null) {
            KeyLoaderGuard guard = new KeyLoaderGuard(keys);
            GuardContext klg = ctx.getGuardian().guard(guard);
            GuardSupport.setThreadContext(klg);
            // disable current context
            ctx.heartbeat(TimeUnit.DAYS.toMillis(365));
        }
        try {
            return loader.loadAll(keys);
        }
        finally {
            if (ctx != null) {
                GuardContext klg = GuardSupport.getThreadContext();
                GuardSupport.setThreadContext(ctx);
                klg.release();
                // reenable current context
                ctx.heartbeat();
            }
        }
    }
}

public static class KeyLoaderGuard implements Guardable {

    Collection<Object> keys;
    GuardContext context;

    public KeyLoaderGuard(Collection<Object> keys) {
        this.keys = keys;
    }

    @Override
    public GuardContext getContext() {
        return context;
    }

    @Override
    public void setContext(GuardContext context) {
        this.context = context;
    }

    @Override
    public void recover() {
        System.out.println("got RECOVER signal");
        context.heartbeat();
    }

    @Override
    public void terminate() {
        System.out.println("got TERMINATE signal");
    }

    @Override
    public String toString() {
        return "KeyLoaderGuard:" + keys;
    }
}
Using custom Guardable provides following advantages:
Service failure policy is responsible for reaction on guardian timeouts and critical service failures. Reaction is configurable, but for standalone Coherence processes I prefer to override this policy.
Below is example of service failure policy, which I find more reasonable for dedicated Coherence nodes.
public class ServiceFailureHandler implements ServiceFailurePolicy {

    private final static Logger LOGGER = LogManager.getLogger(ServiceFailureHandler.class);

    @Override
    public void onGuardableRecovery(Guardable guarable, Service service) {
        LOGGER.warn("Soft timeout detected. Service: " + service.getInfo().getServiceName() + " Task: " + guarable);
        guarable.recover();
    }

    @Override
    public void onGuardableTerminate(Guardable guarable, Service service) {
        LOGGER.error("Hard timeout detected. Service: " + service.getInfo().getServiceName()
                     + " Task: " + guarable + ". Node will be terminated.");
        halt();
    }

    @Override
    public void onServiceFailed(Cluster cluster) {
        LOGGER.error("Service failure detected. Node will be terminated.");
        halt();
    }

    private static void halt() {
        try {
            ThreadUtil.logThreadDump(LOGGER);
            LogManager.shutdown();
            System.out.flush();
            System.err.flush();
        } finally {
            Runtime.getRuntime().halt(1);
        }
    }
}
Compared to standard policy it has following advantages:
Integrating you application with Coherence Guardian doesn't require too much code, but could make your logs more clear and troubleshooting less painful. While it will not make your application work faster, it could save hours of digging though logs.
Two years ago I have published cheat sheet for garbage collection options in HotSpot JVM.
Recently I decided give that work some refreshing and today I'm publishing first HostSpot JVM options ref card covering generic GC options and CMS tuning. (G1 have got a plenty of tuning options during last two years so it will have dedicated ref card).
Content-wise GC log rotation options have been added and few esoteric CMS diagnostic options have been removed.

Today was speaking at HighLoad++ 2013 Moscow. I had two presentation covering deep internals of JVM. One about JIT compilation and other concerning pauseless garbage collection algorithms.
Slide decks are below (in Russian)
Today I was speaking at CEE SECR 2013 at Moscow.
Below is a slide deck from presentation (in Russian)
Oracle Coherence data grid has a powerful tool for inplace data manipulation - EntryProcessor. Using entry processor you can get reasonable atomicity guarantees without locks or transactions (and without drastic performance fees associated).
One good example of entry processor would be built-in ConditionalPut processor, which will verify certain condition before overriding value. This, in turn, could be used for implementing optimistic locking and other patterns.
ConditionalPut could accept only one value, but ConditionalPutAll processor is also available. ConditionalPutAll accepts a map of key/values. Using it, we can update multiple cache entries with single call to NamedCache API.
But there is one caveat.
We have placed values for all keys in single map instance inside of entry processor object.
On the other side, in distributed cache keys are distributed across different processes.
How right values would be transferred to right keys?
Answer is simple - every node, owning at least one of keys to be updated, will receive a copy of whole map of values.
In other words, in mid size cluster (i.e. 20 nodes) you may actually transfer 20 times more data over network than really needed.
Modern networks are quite good and you may not notice this traffic amplification effect for some time (as long as you network bandwidth can handle it). But once traffic has reached network limit things are starting to break apart.
Coherence TCMP protocol is very aggressive at grabbing as much of network bandwidth as it can, so other communications protocols will likely perish first.
JDBC connections are likely victim of bandwidth shortage.
Coherence*Extend connection may also suffer (it is using TCP) and proxy nodes may start to fail in unusual ways (e.g. with OutOfMemoryError due transmission backlog overflow).
This problem may be hard to diagnose. TCP is much more vulnerable to bandwidth shortage and you will be kept distracted with TCP communication problems while root cause is excessive TCMP cluster traffic.
Monitoring TCMP statistics (available via MBean) could give you an insight about network bandwidth consumption by TCMP and network health and help to find root cause.
Isolating TCMP in separate switch is also a good practice, BTW
Simple solution is to split keys set by owning nodes, and then invoke entry processor for each subset individually. Coherence API allows you to find node owning particular key.
This approach is far from ideal though:
Another option is relocating your logic from entry processor to trigger and replacing invokeAll() by putAll() (putAll() does not suffer from traffic amplification).
This solution is fairly good and fast, but has certain drawbacks too:
put() is not just put() now),putAll() call),Finally you can use DataSplittingProcessor from CohKit project. This utility class is using virtual cache keys to transfer data associated with keys, then it is using backing map API to access real entries.
This solution has its PROs and CONs too:
In practice I was using all three technique listed above.
Sometimes triggers fit overall cache design quite good.
Sometimes manual data split has its advantages.
And sometimes DataSplittingProcessor is just right remedy for existing entry processors.
SJK is small command line tool implementing number of helpful commands for JMV troubleshooting. Internally SJK is using same diagnostic APIs as standard JDK tools (e.g. jps, jstack, jmap, jconsole).
Recently I've made few noteworthy additions to SJK package and would like to announce them here.
ttop command now displays memory allocation per thread and cumulative memory allocation for whole JVM process.
Memory allocation rate is key information for GC tuning, in past I was using GC log to derive these numbers. On contrast, per thread allocation counters give you more precise information in real time.
Process allocation rate is calculated by aggregating thread allocation rate.
ttop, gcrep, mx, mxdump) support socket based JMX connections (with optional user/password security).
New command (mx) allows to get/set arbitrary MBean attributes and call arbitrary MBean operations.
This one is paralytically useful for scripting (I didn't find to invoke operation for custom MBean from command line, so I have added it to SJK).
Code and binaries are available at GitHub
https://github.com/aragozin/jvm-tools
Compressed OOPs (OOP – ordinary object pointer) is a technique reducing size of Java object in 64 bit environments. HotSpot wiki has a good article explaining details. Downside of this technique is what address uncompressing is required before accessing memory referenced by compressed OOPs. Instruction set (e.g. x86) may support such addressing type directly, but still, additional arithmetic would affect processing pipeline of CPU.
Young GC involves a lot of reference walking, so its time is expected to be affected by OOPs compression.
In this article, I’m comparing young GC pause time for 64 bit HotSpot JVM with and without OOPs compression. Methodic from previous article is used and benchmark code is available at github. There is one caveat though. With compressed OOPs size of object is smaller and same amount of heap could accommodate more objects. Benchmark is autoscaling number of entries to fill heap based entry footprint and old space size, thus with fixed old space size experiments with compression enabled have to deal with slightly larger number of objects (entry footprints are 288 uncompressed and 246 compressed).
Chart below shows absolute young GC pause times.

As you can see, compressed case is consistently slower, which is not a surprise.
Another char is showing relative difference between two cases (compressed GC pause mean / uncompressed GC pause mean for same case).

Fluctuating line suggests that I should probably increase number of runs for each data points. But, let’s try to make some conclusion from what we have.
For heaps below 4GiB JVM is using special strategy (32 address could be used without uncompressing in this case). This difference is visible from chart (please note that point with 4GiB of old space, means that total heap size is above 4GiB and this optimization is inapplicable).
Above 4 GiB we see 10-30% increase in pause times. You should also not to forget that compressed case have to deal with 17% more data.
Using compressed OOPs affects young GC pause time which is not a surprise (especially taking increase amount of data). Using compression for heaps below 4GiB seems to be a total win, for larger heaps it seems to be reasonable price for increase capacity.
But main conclusion is that experiment has not revealed any surprises neither bad nor good ones. This may be not very exciting but is useful information anyway.
Today was speaking at Oracle Coherence SIG at London.
Below you can find slide deck from my presentation.
http://www.slideshare.net/aragozin/coherence-sig-performance-test-driven-development
In this post, I would like to share some knowledge about optimizing indexes in Oracle Coherence.
Normally you should not abuse queering features of your data grid and, hence, you are unlikely to ever need to tune indexing/queering (besides choosing which indexes to create). But sometimes, you really need to squeeze as much performance as you can from your filter based operations. If it is your case, then few tricks described below may be helpful.
You are probably aware of this fact, but it is of critical importance and repeating this one more time will not do any harm. All query planning in Coherence relies on matching (using equals() method) of extractors used in index and filter.
Typical mistakes you could do here:
equals() and hashCode().In all cases above, your code will work, but index will not be used.
Sometimes your query may include criterion for low-cardinality attribute. Not indexing this attribute will cause deserialization of all candidate entries to check attribute value.
Deserialization is something you really want to avoid in Coherence cluster under heavy load. Besides being CPU consuming, deserialization will produce a lot of garbage, risking to bringing you GC out of balance.
Adding index may bring another risk though. If you put your predicates in wrong order, such index may only slow down query.
Below is result of simple benchmark. I was using 2 Coherence storage nodes and 1000000 as data set. Ticker predicate is matching 1000 objects, and side predicate matching 500000. EqualsFilter and AndFilter were used to build query. Execution time of count aggregator was measured.
Tests were run on my laptop, so absolute numbers are not important (and not statistically sound to be honest).
As you can see, if you are unlucky and your query is not in right order, adding index may actually harm query performance.
There is a trick to protect you in this case. NoIndexFilter is a filter wrapper, which disables inverted index lookup for nested index. Forward map of index remains accessible, so testing attribute value will not require desrialization.
As you can see, it takes some toll on "good query", but negates effect of "wrong order of predicates". You can also see that it is still 3 times faster than case where "side" was not indexed.
You can make query above even more faster if you really need to.
Normally, with Coherence, you do not use composite indexes (instead you are indexing attributes individually). Creation of composite index is possible, but you will have to use specially composed queries to exploit composite index.
Code to add composite index will look like
ValueExtractor[] ve = {
    new ReflectionExtractor("getTicker"),
    new ReflectionExtractor("getSide")
};
MultiExtractor me = new MultiExtractor(ve);
cache.addIndex(me, false, null);
and filter exploiting it will look like
ValueExtractor[] ve = {
    new ReflectionExtractor("getTicker"),
    new ReflectionExtractor("getSide")
};
MultiExtractor me = new MultiExtractor(ve);
EqualsFilter composite = new EqualsFilter(me, Arrays.asList(ticker, side));
Below are results compared with traditional index/query.
Composite index is awkward to use, but, if it matches your case, you can get significant performance gain.
That is it, for this post. You can also take a look at my slide deck from one of London Coherence SIGs, it explains few more advanced topics about indexes in Oracle Coherence.
This is a first articles in series, where I would like to study effect of various HotSpot JVM options on duration of STW pauses associated with garbage collection.
This article will study how number of parallel threads affects duration of young collection Stop-the-World pause. HotSpot JVM has several young GC algorithms. My experiments are covering following combinations:
There is also PSNew (Parallel Scavenge) algorithm similar to ParNew, but it cannot be used together with Concurrent Mark Sweep (CMS), so I have ignored it.
In experiments, I was using synthetic benchmark producing evenly distributed load on memory subsystem. Size of young generation was same for all experiments (64MiB). Two versions of HotSpot JVM were used: JDK 6u43 (VM 20.14-b01) and JDK 7u15 (VM 23.7-b01).
Test box was equipped with two 12 core x 2 hardware threads CPUs (totaling in 48 hardware threads).
Mark Sweep Compact is prone to regular full GCs, so it is not a choice for pause sensitive applications. But it shares same young collection algorithms/code with concurrent collector and produces less noisy results, so I added to better understand concurrent case.
Difference between single thread case and 48 thread case is significant so number are present in two graphics.


Note worthy (not surprising though), that serial algorithm performs slightly better than parallel with one thread. Discrepancy between Java 6 and Java 7 is also interesting, but I have no ideas now to explain that.
From graphics above you can get an idea that more threads is better, but it is not obvious how exactly better. Graphics below show effective parallelization (8 thread case is taken as base value, because smaller numbers of threads are producing fairly noisy results).


You can see almost linear parallelization up to 16 threads. It is also worth to note, that 48 threads are considerably faster that 24 even though there are only 24 physical cores. Effect of parallelization is slightly better for larger heap sizes.
Concurrent Mark Sweep is a collector used for pause sensitive applications and young collection pause time is something that you probably really care if you have consciously chosen CMS. Same hardware and same benchmark were used.
Results are below.
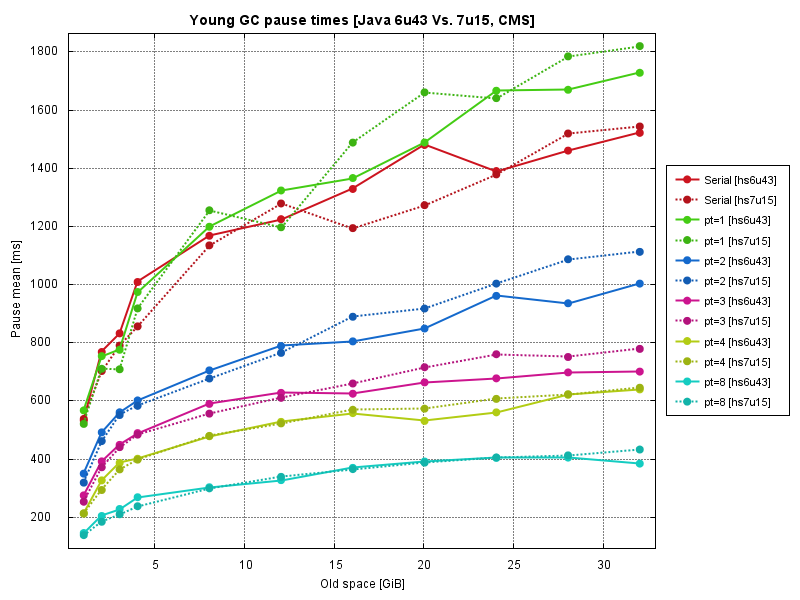

Compared to Mark Sweep Compact, concurrent algorithm is producing much noisy results (especially for small number of threads).
Java 7 is systematically showing worse performance compared to Java 6, not too much though.


Parallelization diagrams, show us same picture - linear scalability, which degrades with greater number of threads (experiment conditions is slightly different for CMS and MSC cases, so direct comparison of these diagrams is not correct).
Tests have confirmed that parallel young collection algorithms in HotSpot JVM scales extremely well by number of CPU cores. Having a lot of CPU cores on server will help you greatly with JVM Stop-the-World pauses.
Source code used for benchmarking and its description is available at GitHub.
github.com/aragozin/jvm-tools/tree/master/ygc-bench
There are bunch of graphical tools helping you to look inside of running JVM (VisualVm and JConsole are extremely helpful). Unfortunately, some times (almost always in my case), you may find yourself in SSH console on headless server side by side with your JVM process, trying to investigate problem.
You can connect to remote JVM process via JMX in VisualVM and there are other interesting tools like CRaSH offering a lot of goodies for troubleshooting. But …
CLI tools are leveraging OS security and will work in your SSH console, reliving you from all pains above.
Of cause there are CLI tools in your JDK package. Let me highlight few tools from Oracle’s stock JDK.
This one could list you JVM process (instead of doing ps … | grep java). Similar to ps it could display command line arguments of process. It is useful to find PID of JVM you are interested in, which will be required for other tool.
This little tool will allow you to take adhoc head dumps and calculate memory footprint histograms by classes. It also can be used to enfore full GC on target JVM. Be careful, some of jmap operations could cause STW pauses in target JVM.
Dump your thread stacks, look though your locks.
JVM exposed a lot of internal details (e.g. memory size, compilation statistics, etc). jstat could report some of this data. Output is fairly cryptic (and machine oriented), but never less helpful.
Introspect –XX options of running JVM. You could also change some of them for live JVM process (e.g. enable -XX:+PrintGCDetails to add GC details in application log).
Behind the scene JVM have several internal protocols which could be used by diagnostic tools (not to count JMX):
Both Attach API and perf data are lightweight, fairly unintrusive for monitored application and could be easily used from Java code.
Some time ago I was blogging about few tools using Attach API and JMX – jtop and gcrep. Since then, few things have changed:
But most important new cool features have been added:
Stock jps can print command line, but it is as far as it can help you. SJK’s version of jps allows you to choose which information about process you would like to be shown. E.g. you can add value of specific system property or –XX flag to the output. Another improvement is build-in filter option. You can filter java processes by command line (which includes main class name) and system properties.
Thread top command was also improved. Sort option has been added and you also can limit number of threads in output to top N. Additinally, filter option will help you to monitor only certain threads.
This command will dump all MBeans from process to json format.
“Heap histo” command is extended version of jmap –histo. Killer feature is --dead flag which will display histogram of garbage in heap (actually tool will take 2 histograms: all heap and live object – and show difference).
You can download sjk jars here.
Or build from sources https://github.com/aragozin/jvm-tools
I'm glad to announce upcoming tech talk in our user group at Moscow - "Java GC — Theory and Practice"
Event will be held on 16 May at Moscow, online translation will be available (tech talk language - russian)
Registration is open at http://aragozin.timepad.ru/event/60137/
В программе:
Алгоритмы сборки мусора. Слабая гипотеза о поколения. Механизмы барьеров записи. Математикечкая модель длительности пауз для Concurent Mark Sweep.
Принципы сайзинга памяти JVM. Тюнинг сборщика молодого поколения. Фрагментация. Специальные ссылки. Паузы не связанные со сборкой мусора.
Работа с off-heap. Shareв read-only heap region. G1 и тренды развития HotSpot.
Below are slidedecks (in russian) from two my presentation on JavaOne Russia this year.
http://www.slideshare.net/aragozin/g-19935502
Today, I was one of speaker at "Magic of VMs" tech talk in Moscow. Meet up was held under roof of Rambler, a lot thanks to them for helping us in this event.
Topic of meetup was low level implementation details of various runtimes for popular platforms.
Below are link to slidedecks from presentation:
Dmitri Babaev
http://www.slideshare.net/DmitriBabaev1/python-and-ruby-vms
Anton Lebedevich
http://mabrek.github.io/erlang-vm-presentation-2013/
Alexey Ragozin
http://www.slideshare.net/aragozin/devirtualization-of-method-calls
Writing automated tests for Coherence based application is quite challenging. Definitely, you can start single node cluster in your test JVM without too much hassle. Unfortunately, single node cluster will not allow you to replicate some important aspects of cluster (a thus, test wont be able to catch a number of nasty bugs).
Running Coherence cluster with several nodes is a bit trickier (Coherence is using singletons). Idea to use classloader to keep multiple Coherence nodes is not new. I’m using this approach for few years already, and …
Today I’m glad to announce availability of my test library for Coherence at Maven central repo.
ChTest is a third generation of my test framework for Oracle Coherence. Besides ability to run multiple Coherence nodes in different classloader, ChTest offers a bunch of extra features.
To name few:
Below is slide deck outlining features of ChTest.
Add following Maven dependency and you would be able to try ChTest yourself.
<dependency>
    <groupId>org.gridkit.coherence-tools</groupId>
    <artifactId>chtest</artifactId>
    <version>0.2.6</version>
    <scope>test</scope>
</dependency>
First meet up of Oracle Coherence users in Moscow was held on 14 Mar.


Many thanks to Gene Gleyzer (Oracle), who was key speaker on this event (joining us remotely).
Below are slides from event:
Recently, I was working on renewed version of Coherence data loss listener. New version provides simple utility to attach partition loader to any cache. Such partition loader is guaranteed to be called for every partition of newly created cache or after partition has been lost. Unlike CacheStore, partition loader will be called on the node there it has been added. This way you could have dedicated set loader processes, which are not involved at storing a data. Also it is guaranties that
But let’s get back to a topic of post. I’m actively using JUnit and my test-utils library to automate testing of my Coherence stuff. Test-utils is using class loader isolation to run multiple Coherence nodes in single JVM.
But, unlike many other tests, here I need to test disaster case. Coherence should think that one of its nodes has died. Normally, I’m using CacheFactory.shutdown() to kill virtualized Coherence node, but this way it would be a graceful shutdown.
For data loss listener, I really want to test disaster case.
Naïve approach using timeout is not working well with data grid prioritizing resilience and performance such as Coherence.
What is problem with timeout?
If you let it be too short, there will be too many false positives making grid unstable (JVM may do a GC, OS may start swapping, etc).
If you let it be too long, time of recovery from disaster would be too long.
How this can be improved? Let’s see that kind of disaster could possibly happen with your cluster:
Death of process could be easily tracked if you keep open TCP connection open. OS will close all TCP connections for dead process, so you could make very good assumption that remote process is dead.
Coherence is using so called TCP ring for that purpose. Each cluster node keeps two open TCP connections to other cluster nodes (forming a ring). If cluster detects that both TCP connections have been closed, it has very good reason to disconnect node right now and start recovery procedure.
In case of server/network failure, TCP connection will not be closed immediately. In addition to TCP ring, Coherence is using IP monitor to track reachability of IP addresses. If IP address cannot be reached by rest of nodes, cluster will not hesitate to disconnect all nodes from that IP.
This two tricks allow Coherence to detect real failure very fast, yet to be very tolerant to long GC pauses and other non fatal slowdowns.
In JUnit test all nodes in cluster are sharing same JVM. I cannot really kill a process. To simulate node death, I’m calling Thread.suspend() on all threads related to victim node (a feature of test-utils). This is making node totally unresponsive.
Two mechanisms above should be turned off in Coherence operational configuration. Disconnect timeout also should be set to smaller value (otherwise each test will take too long).
That is it, now I can test disaster cases for Coherence using JUnit.
Below is snippet of actual test:
Here is a link to full java file in SVN.
SSH offers a very convenient way to execute shell scripts remotely. Code like
ssh myserver.acme.com
<< EOC
cd $APP_HOME
./start_my_stuff.sh
EOC
are fairly easy to write and read.
But while remote execution itself is easy, writing actual distributed code is total mess.
I’m a Java
guy. I wish, I could run Java code remotely as easy as I can do it with shell.
And now, finally, I can.
And that snippet will work for you too, only two requirements are:
That is it, there is no need to install anything special to target servers.
You can find more details in tutorial at GridKit site.
A lot of black magic is happening behind the scene. In particular:
By despite
all that internal complexity, it just works. I’m using it to run agents on
Linux and Solaris. I was using that stuff on Amazon EC2 and I cloud have master
process running on my Windows desktop while slave scattered across Unixes.
It was long road. A lot of issues such as firewalls, bugs in JSch (java SSH client),
subtle SSH limitation, etc has been solved along that path.
But now, I believe, it will “just work” for you too.
But what is the need for such library in a first place? Below are just few of my reasons:
Ability to effortlessly run remote java code is not much by itself. But it enables you to reach new levels of day-to-day automation (which was prohibitively expensive before).
But that would be topic for another post.


