After three years, I have decided to update my GC cheat sheet.
New version finally includes G1 options, thankfully there are not very many of
them. There are also few useful options introduced to CMS including parallel inital mark and initiating concurrent cycles by timer.
Finally, I made separate cheat sheet versions for Java 7 and Java 8.
Automatic memory management (garbage collection) is one of essential aspects of Java platform. Garbage collection relieves developers from pain of memory management and protects them from whole range of memory related issues. Though, working with external resources (e.g. files and socket) from Java becomes tricky, because garbage collector alone is not enough to manage such resources.
Originally Java had finalizers facility. Later special reference classes were added to deal with same problem.
If we have some external resource which should be deallocated explicitly (common case with native libraries), this task could be solved either using finalizer or phantom reference. What is the difference?
Finalizer approach
Code below is implementing resource housekeeping using Java finalizer.
public class Resource implements ResourceFacade {

    public static AtomicLong GLOBAL_ALLOCATED = new AtomicLong();
    public static AtomicLong GLOBAL_RELEASED = new AtomicLong();

    int[] data = new int[1 << 10];
    protected boolean disposed;

    public Resource() {
        GLOBAL_ALLOCATED.incrementAndGet();
    }

    public synchronized void dispose() {
        if (!disposed) {
            disposed = true;
            releaseResources();
        }
    }

    protected void releaseResources() {
        GLOBAL_RELEASED.incrementAndGet();
    }
}

public class FinalizerHandle extends Resource {

    protected void finalize() {
        dispose();
    }
}

public class FinalizedResourceFactory {

    public static ResourceFacade newResource() {
        return new FinalizerHandle();
    }
}
Phantom reference approach
public class PhantomHandle implements ResourceFacade {

    private final Resource resource;

    public PhantomHandle(Resource resource) {
        this.resource = resource;
    }

    public void dispose() {
        resource.dispose();
    }

    Resource getResource() {
        return resource;
    }
}

public class PhantomResourceRef extends PhantomReference<PhantomHandle> {

    private Resource resource;

    public PhantomResourceRef(PhantomHandle referent, ReferenceQueue<? super PhantomHandle> q) {
        super(referent, q);
        this.resource = referent.getResource();
    }

    public void dispose() {
        Resource r = resource;
        if (r != null) {
            r.dispose();
        }
    }
}

public class PhantomResourceFactory {

    private static Set<Resource> GLOBAL_RESOURCES = Collections.synchronizedSet(new HashSet<Resource>());
    private static ResourceDisposalQueue REF_QUEUE = new ResourceDisposalQueue();
    private static ResourceDisposalThread REF_THREAD = new ResourceDisposalThread(REF_QUEUE);

    public static ResourceFacade newResource() {
        ReferedResource resource = new ReferedResource();
        GLOBAL_RESOURCES.add(resource);
        PhantomHandle handle = new PhantomHandle(resource);
        PhantomResourceRef ref = new PhantomResourceRef(handle, REF_QUEUE);
        resource.setPhantomReference(ref);
        return handle;
    }

    private static class ReferedResource extends Resource {

        @SuppressWarnings("unused")
        private PhantomResourceRef handle;

        void setPhantomReference(PhantomResourceRef ref) {
            this.handle = ref;
        }

        @Override
        public synchronized void dispose() {
            handle = null;
            GLOBAL_RESOURCES.remove(this);
            super.dispose();
        }
    }

    private static class ResourceDisposalQueue extends ReferenceQueue<PhantomHandle> {

    }

    private static class ResourceDisposalThread extends Thread {

        private ResourceDisposalQueue queue;

        public ResourceDisposalThread(ResourceDisposalQueue queue) {
            this.queue = queue;
            setDaemon(true);
            setName("ReferenceDisposalThread");
            start();
        }

        @Override
        public void run() {
            while(true) {
                try {
                    PhantomResourceRef ref = (PhantomResourceRef) queue.remove();
                    ref.dispose();
                    ref.clear();
                } catch (InterruptedException e) {
                    // ignore
                }
            }
        }
    }
}
Implementing same task using phantom reference requires more boilerplate. We need separate thread to handle reference queue, in addition, we need to keep strong references to allocated reference objects.
How finilaizers work in Java
Under the hood, finilizers work very similarly to our phantom reference implementation, though, JVM is hiding boilerplate from us.
Each time instance of object with finalizer is created, JVM creates instance of FinalReference class to track it. Once object becomes unreachable, FinalReference is triggered and added to global final reference queue, which is being processed by system finalizer thread.
So finalizes and phantom reference approach work very similar. Why should you bother with phantom references?
Comparing GC impact
Let's have simple test: resource object is allocated then added to the queue, once queue size hits limit oldest reference is evicted and thrown away. For this test we will monitor reference processing via GC logs.
As you can see, once object becomes unreachable, it needs to be handled in GC reference processing phase. Reference processing is a part of Stop-the-World pause. If, between collections, too many references becomes eligible for processing it may prolong Stop-the-World pause significantly.
In case above, there is no much difference between finalizers and phantom references. But let's change workflow a little. Now we would explicitly dispose 99% of handles and rely on GC only for 1% of references (i.e. semiautomatic resource management).
For finalizer based implementation there is no difference. Explicit resource disposal doesn't help reduce GC overhead. But with phantoms, we can see what GC do not need to handle explicitly disposed references (so number of references process by GC is reduced by order of magnitude).
Why this is happening? When resource handle is disposed we drop reference to phantom reference object. Once phantom reference is unreachable, it would never be queued for processing by GC, thus saving time in reference processing phase. It is quite opposite with final references, once created it will be strong referenced by JVM until being processed by finalizer thread.
Conclusion
Using phantom references for resources housekeeping requires more work compared to plain finalizer approach.
But using phantom references you have far more granular control over whole process and implement number of optimizations such as hybrid (manual + automatic) resource management.
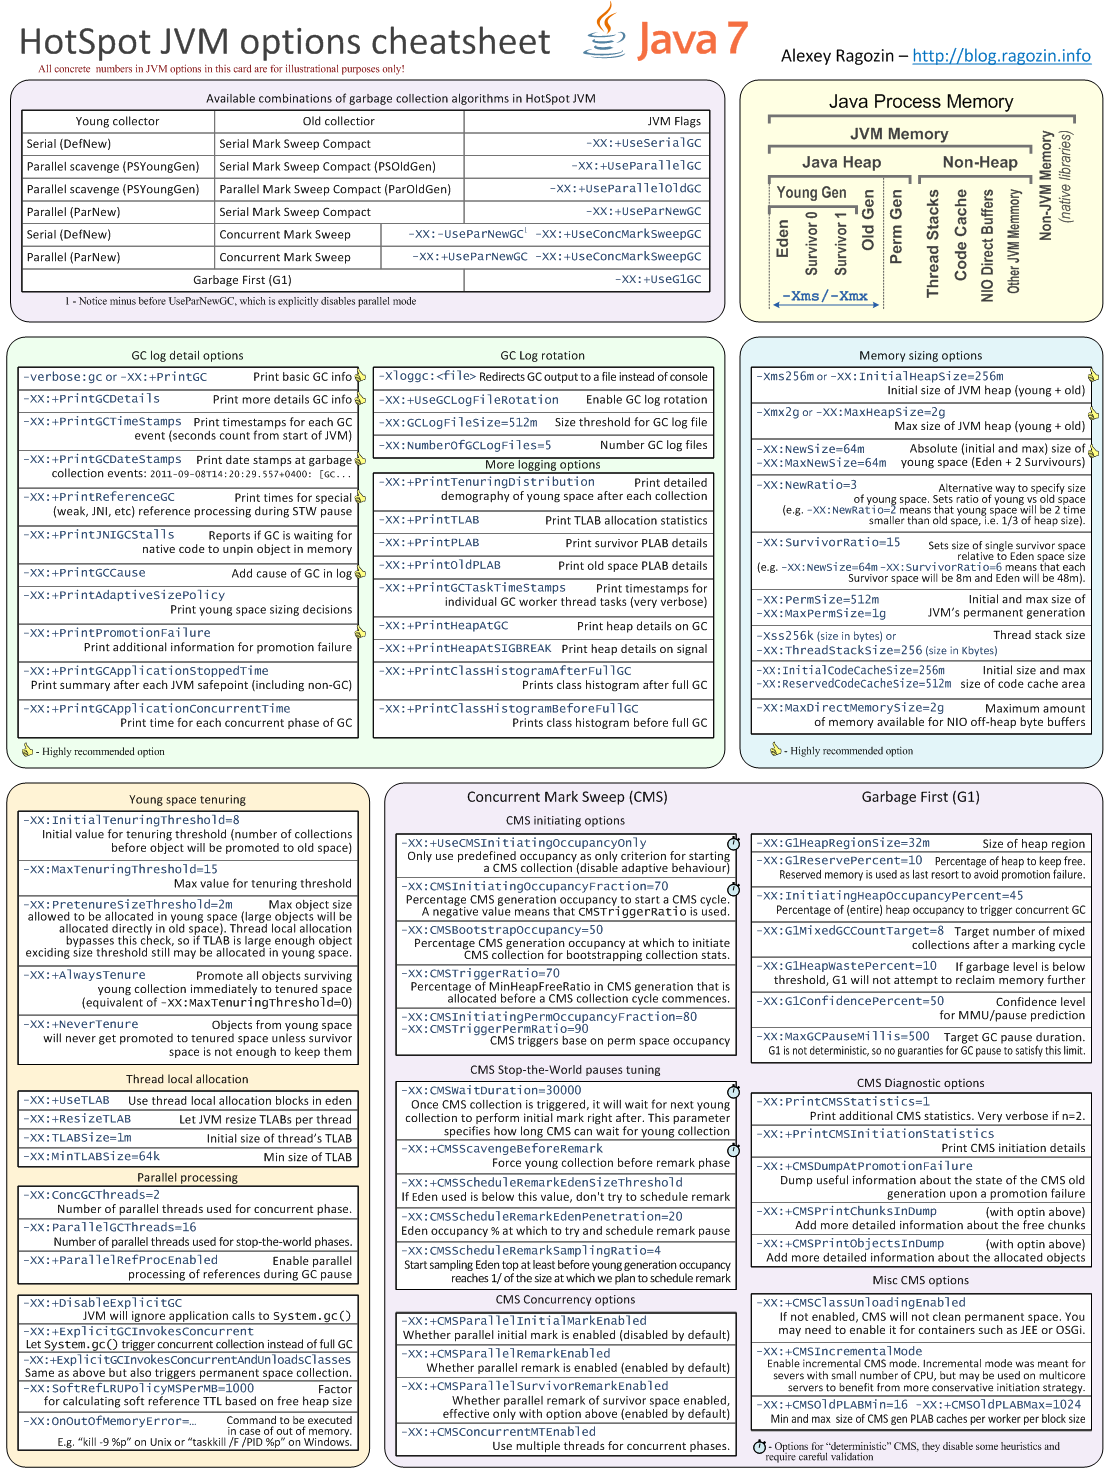
Recently I decided give that work some refreshing and today I'm publishing first HostSpot JVM options ref card covering generic GC options and CMS tuning. (G1 have got a plenty of tuning options during last two years so it will have dedicated ref card).
Content-wise GC log rotation options have been added and few esoteric CMS diagnostic options have been removed.
This is a first articles in series, where I would like to study effect of various HotSpot JVM options on duration of STW pauses associated with garbage collection.
This article will study how number of parallel threads affects duration of young collection Stop-the-World pause. HotSpot JVM has several young GC algorithms. My experiments are covering following combinations:
Serial young (DefNew), Mark Sweep Compact old
Parallel young (ParNew), Mark Sweep Compact old
Serial young (DefNew), Concurrent Mark Sweep old
Parallel young (ParNew), Concurrent Mark Sweep old
There is also PSNew (Parallel Scavenge) algorithm similar to ParNew, but it cannot be used together with Concurrent Mark Sweep (CMS), so I have ignored it.
In experiments, I was using synthetic benchmark producing evenly distributed load on memory subsystem. Size of young generation was same for all experiments (64MiB). Two versions of HotSpot JVM were used: JDK 6u43 (VM 20.14-b01) and JDK 7u15 (VM 23.7-b01).
Test box was equipped with two 12 core x 2 hardware threads CPUs (totaling in 48 hardware threads).
Mark Sweep Compact
Mark Sweep Compact is prone to regular full GCs, so it is not a choice for pause sensitive applications. But it shares same young collection algorithms/code with concurrent collector and produces less noisy results, so I added to better understand concurrent case.
Difference between single thread case and 48 thread case is significant so number are present in two graphics.
Note worthy (not surprising though), that serial algorithm performs slightly better than parallel with one thread. Discrepancy between Java 6 and Java 7 is also interesting, but I have no ideas now to explain that.
From graphics above you can get an idea that more threads is better, but it is not obvious how exactly better. Graphics below show effective parallelization (8 thread case is taken as base value, because smaller numbers of threads are producing fairly noisy results).
You can see almost linear parallelization up to 16 threads. It is also worth to note, that 48 threads are considerably faster that 24 even though there are only 24 physical cores. Effect of parallelization is slightly better for larger heap sizes.
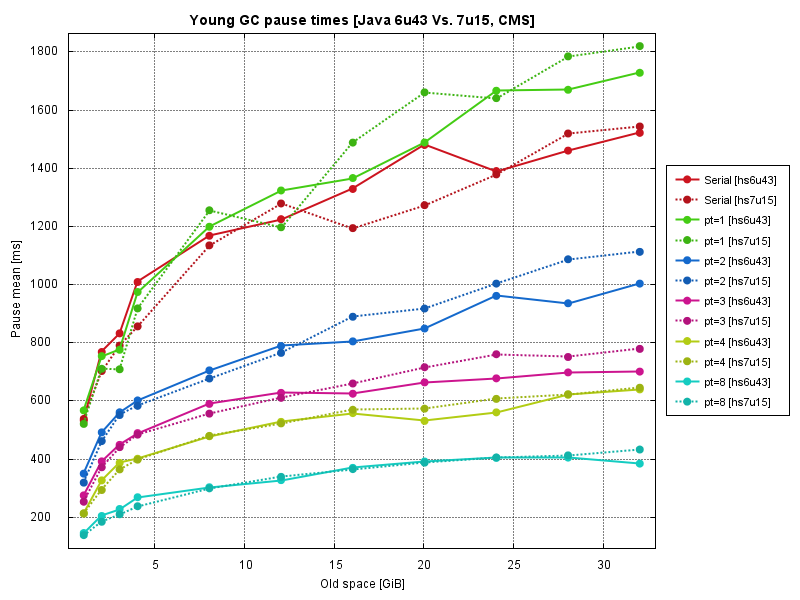
Concurrent Mark Sweep
Concurrent Mark Sweep is a collector used for pause sensitive applications and young collection pause time is something that you probably really care if you have consciously chosen CMS. Same hardware and same benchmark were used. Results are below.
Compared to Mark Sweep Compact, concurrent algorithm is producing much noisy results (especially for small number of threads).
Java 7 is systematically showing worse performance compared to Java 6, not too much though.
Parallelization diagrams, show us same picture - linear scalability, which degrades with greater number of threads (experiment conditions is slightly different for CMS and MSC cases, so direct comparison of these diagrams is not correct).
Conclusions
Tests have confirmed that parallel young collection algorithms in HotSpot JVM scales extremely well by number of CPU cores. Having a lot of CPU cores on server will help you greatly with JVM Stop-the-World pauses.
Recently, a comment on other article of this blog has led me
to noteworthy issue with CMS (Concurrent Mark Sweep) garbage collector.
Problem has appeared after minor release of application. JVM
was configured to use CMS and it was working fine, but after a change its
behavior has changed. Normally CMS is doing collection cycle when old space
usage meets certain threshold, so you can see famous saw of heap usage.
Most time CMS is staying idle, just occasionally doing a
collection. But after release, heap usage diagram have changed to something
like this.
For some reason CMS is not waiting for heap usage threshold
anymore and doing one old space GC cycle right after another. Heap usage
diagram may not look bad by itself, but continuous background GC means that at
least one core is constantly occupied by marking and sweeping old space. In
addition, sweeping over memory also impacts cache utilization in CPUs causing
additional impact to performance.
My first guess about –XX:+UseCMSInitiatingOccupancyOnly
flag being missed was wrong (you know without that flag JVM could adjust CMS
initiation threshold at runtime according to internal heuristics), CMS setup
was fine.
After scanning through options, –XX:+CMSClassUnloadingEnabled flag has drawn my
attention. By default CMS will not collect permanent space; you should use that
flag to enable it. Permanent space is a special memory space used by Java class
objects and some JVM data structures; it is not part of application heap and being
sized separately. It means, in particular, that permanent space has its own
memory usage which is not correlated with old space memory usage.
So, if CMS for permanent space is enabled, GC cycle will be
triggered if either old space or
permanent space has reached usage threshold. This turned out to be a
problem. Permanent space was a little too small for application, so CMS were
trying to collect it relentlessly.
Increasing permanent space size (-XX:PermSize=size)
has solved an issue.
Alternative approach could be using different threshold for
old and permanent space (i.e. –XX:
CMSInitiatingPermOccupancyFraction=percent).
Also it may make a sense to turn off permanent space collection at all, many applications
just do not need it (it was called “permanent” for reason after all).